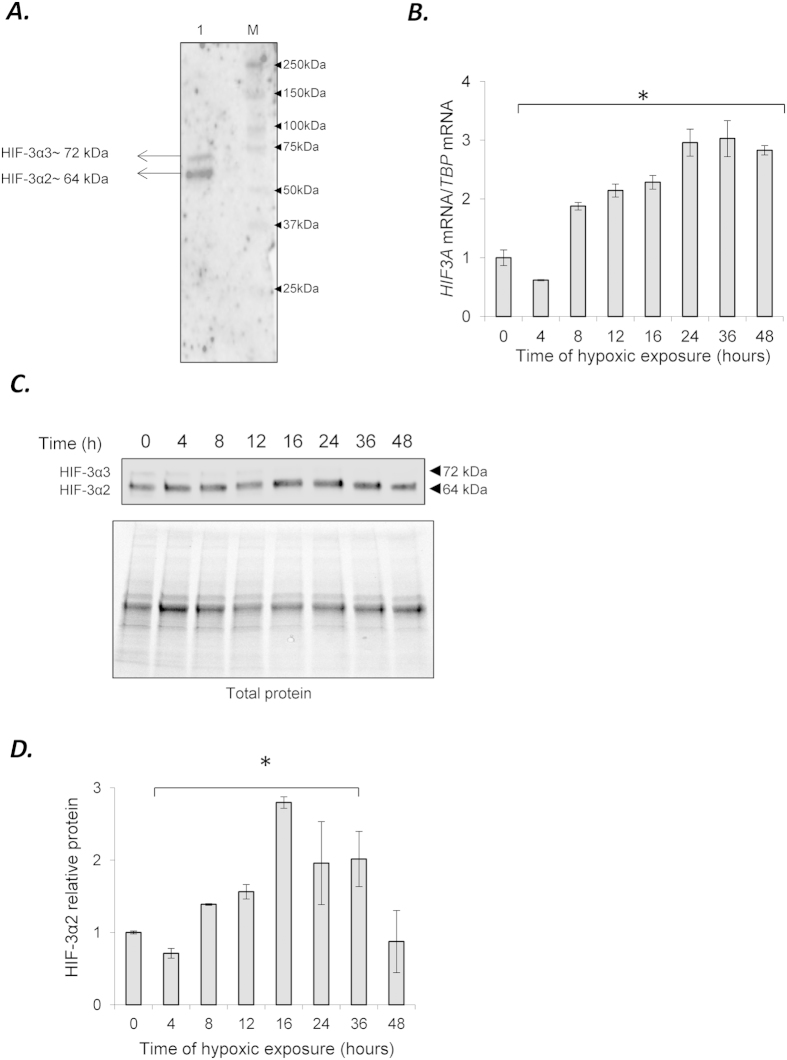
Figure 1. Expression of HIF3α isoforms in HUVECs.
(A) The anti-HIF-3α (Sigma-Aldrich, AV39936) antibody allows detection of HIF-3α2 (~72 kDa) and when overexposed, HIF-3α1 (~72 kDa). The HUVECs cell lysate is shown in lane 1 (5 μq loaded), and the molecular weight markers (M) are shown in lane 2 (Precision plus Kaleidoscope, BioRad #161-0375). (B) Hypoxia induces dynamic changes in the mRNA expression profiles of the HIF3A2–3 variants in HUVECs. The mRNA levels were monitored in qRT-PCR experiments. The results from 3 independent experiments (n = 12) are plotted normalized to TBP mRNA levels and expressed as a fold-change over the normoxic control. Error bars represent standard deviations (*P < 0.05). (C) Hypoxia induces dynamic changes of protein levels of HIF-3α2 and (D) the bar graphs show the relative protein amounts at each time point. The protein levels of were detected with SDS-PAGE and Western Blot and related to total protein levels. 2 individual samples (4 μg of total protein per lane) were tested for each time point and the experiments were repeated twice. The protein levels (bar graphs) are normalized to the normoxic control. Significant changes (p < 0.05) are marked with an “*”.

