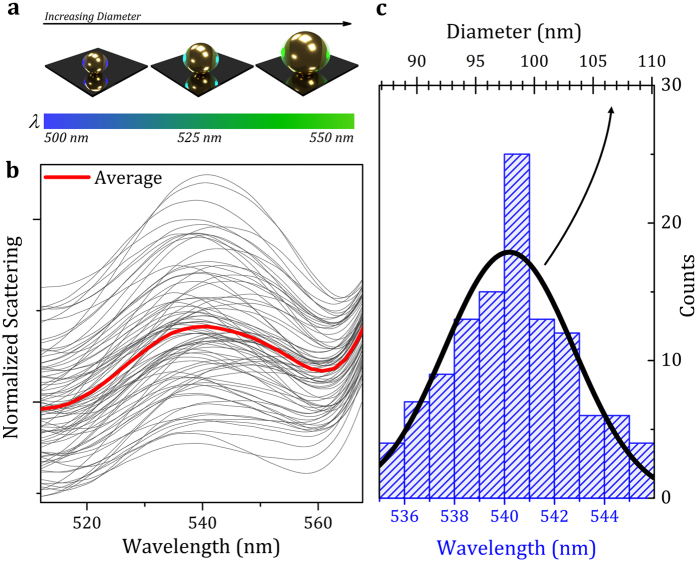
Figure 5. Measurement of the Diameter of Single Nanoparticles.
(a) Schematic drawing representing the wavelength-dependence of the  mode on the nanoparticle size. (b) Normalized S-polarized spectra of the 177 single nanoparticles in the spectral range near to the
  mode; red solid line represents the average of all the scattering spectra. (c) Histogram distribution of the spectral position of the
  mode (bottom axis). Solid black line represents the calculated Gaussian distribution of nanoparticle diameter population (top axis).

