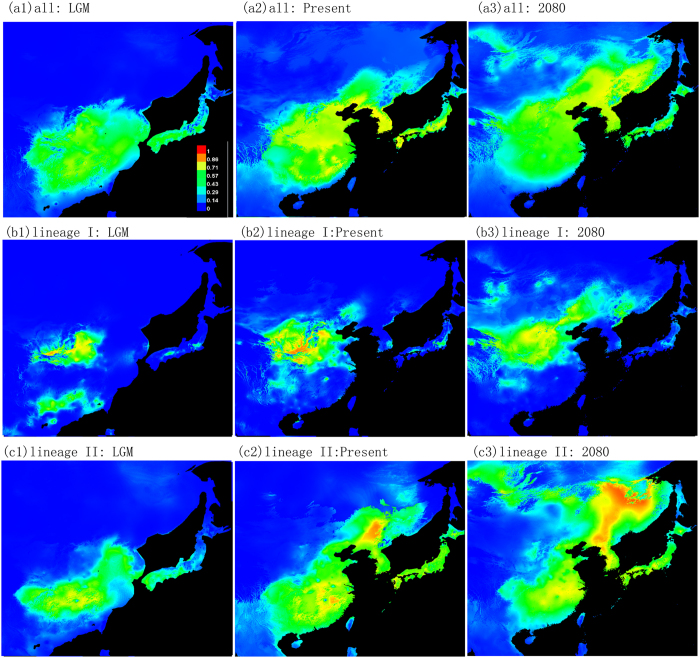
Figure 4. Potential distributions as the probability of occurrence for wild soybean.
Suitability values indicate logistic probabilities ranging from 0–1, with increasingly darker shades of red with increasing habitat suitability. (a) All populations; (b) Lineage I; (c) Lineage II (MAXENT v3.3.3 & Adobe illustrator CS2).

