
Figure 3. Two sample logos of hemolytic and non-hemolytic peptides of HemoPI-1 dataset.
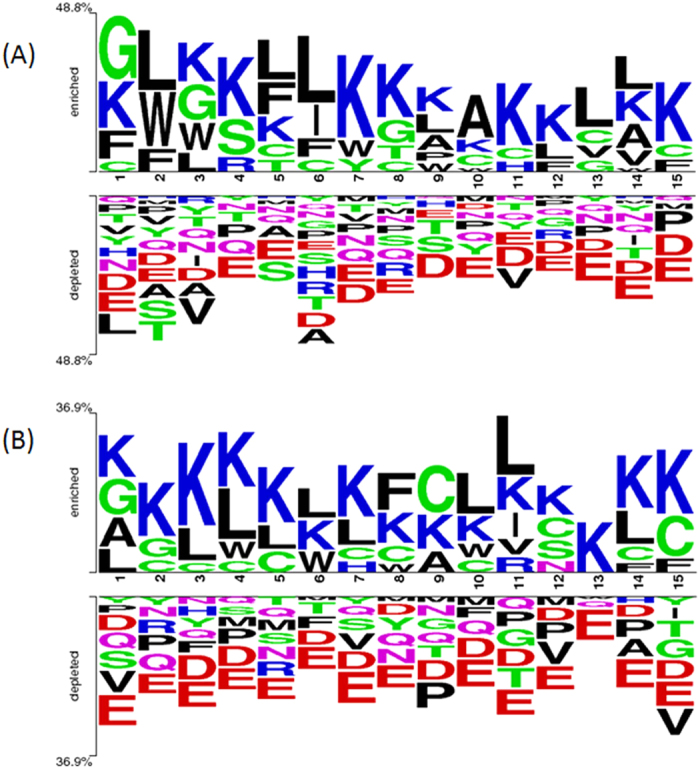
The figure depicts the two sample logos of: (A) first fifteen residues (N-terminus) and (B) last fifteen residues (C-terminus) of hemolytic (enriched) and non-hemolytic (depleted) peptides, where size of residue is proportional to its propensity.