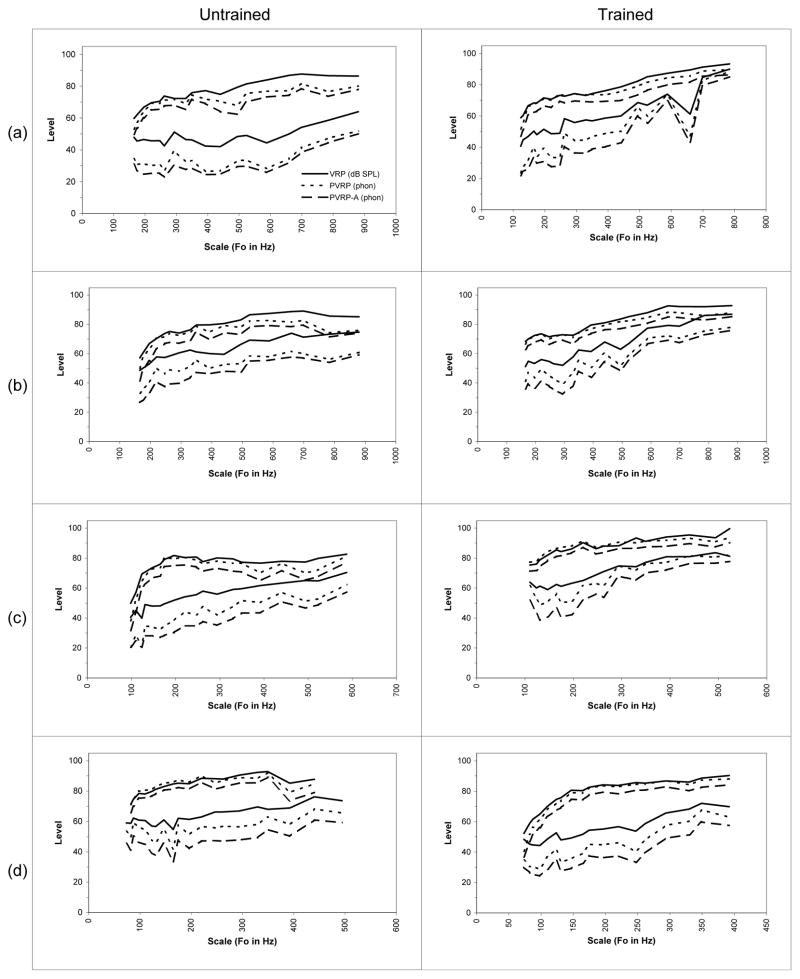
Figure 4.
Voice Range Profiles (solid lines) across the three vowels are shown along with predicted Perceived Voice Range Profile (PVRP, dotted lines) based on equal loudness contours, and the PVRP-A (dashed lines) as based on A-weighting. The PVRP level in phon can be compared to the dB SPL of a 1 kHz tone.

