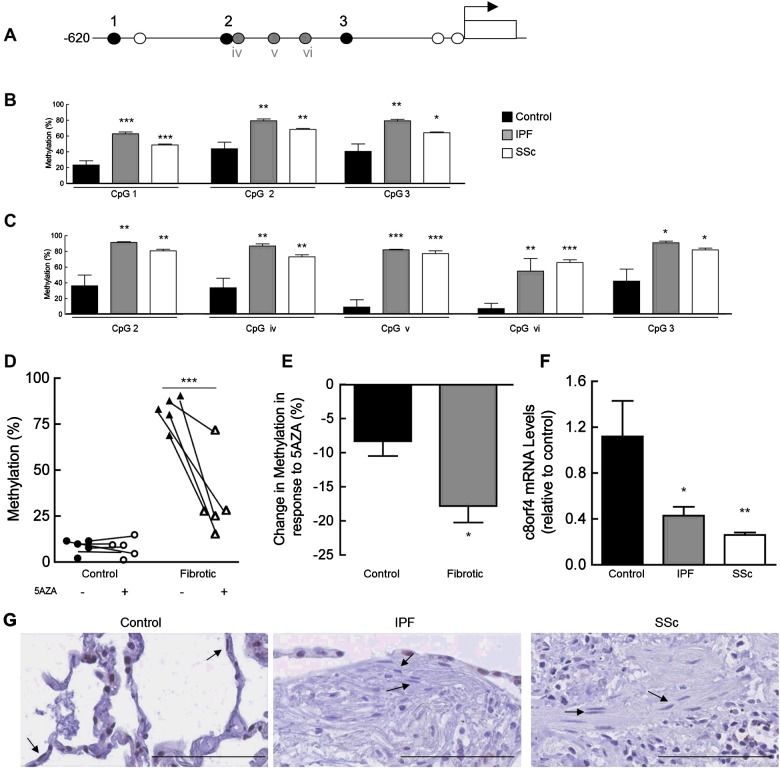
Figure 4. Increased methylation and decreased expression of c8orf4 in fibrotic lung fibroblasts.
A schematic representation of the upstream 5′ region of c8orf4 (A). Circles indicate the location of CpG sites. Black circles represent the three CpG sites on the Illumina array, grey circles represent three additional sites tested by bisulfite sequencing and white circles represent untested CpG sites within the region. Genomic DNA extracted from primary fibroblasts was assessed and mean percentage methylation at each CpG site within each group is shown (B). Genomic DNA extracted from control, IPF and SSc cell lines were bisulfite treated and subjected to bisufite sequencing (C). Five CpG sites within the c8orf4 promoter were analysed. Mean percentage methylation at each CpG site within each of the groups is shown (C). For (B, C, E and F) data are derived from six control, five IPF and seven SSc donor fibroblast isolates. ***P<0.001, **P<0.01 and *P<0.05, compared with levels in control cells, one-way ANOVA with Tukey's post-test. DNA extracted from representative control and fibrotic fibroblasts treated with or without 1 μM 5AZA for ≥1 week was subjected to bisufite sequencing, as above (D). Each point represents the % methylation at the five individual CpG sites analysed in panel C (***P<0.001 compared with non-5Aza treated, two-way ANOVA with Bonferroni post-test). Control, IPF and SSc lung fibroblast lines were treated with 1 μM 5AZA as above, and DNA subjected to bisulfite sequencing (E). Data are enumerated as mean % DNA methylation across all five CpG sites within each group (*P<0.05, compared with levels in control cells). RNA extracted from control and fibrotic cell lines was subjected to qPCR for c8orf4 mRNA (F). Data are enumerated as mRNA levels relative to mean basal levels in control cells (±S.E.M., **P<0.01 and *P<0.05, one-way ANOVA with Tukey's post-test). Representative photomicrographs of control (n=3), IPF (n=6) and SSc (n=1) lung showing immunohistochemical localization of c8orf4 stained brown/black (G). Arrows indicate nuclear c8orf4 staining in control lung fibroblast-like cells but staining was weak or undetectable in fibrotic lung fibroblasts (scale bar represents 50 μm).

