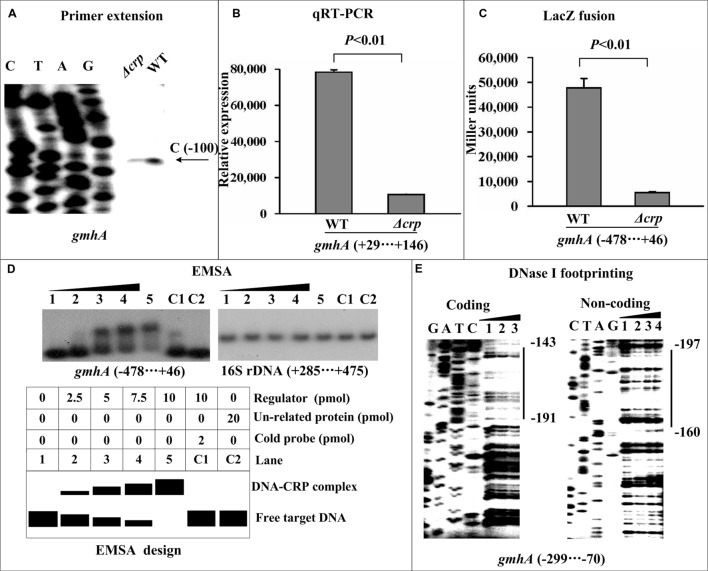
FIGURE 2.
Direct activation of gmhA transcription by CRP. Lanes C, T, A, and G represent Sanger sequencing reactions. The minus and positive numbers indicated nucleotide positions upstream and downstream of the indicated genes. (A) Primer extension. An oligonucleotide primer was designed to be complementary to the RNA transcript of each indicated gene. The primer extension products were analyzed on an 8 M urea-6% acrylamide sequencing gel. The transcriptional start sites are indicated by arrows, showing the nucleotides. (B) Quantitative RT-PCR. The mRNA levels of gmhA were compared between Δcrp and WT. A standard curve was generated for each RNA preparation with the 16S rRNA gene; the relative mRNA level was determined by calculating the threshold cycle (ΔCt) of target genes via the classic ΔCt method. (C) LacZ fusion. The target promoter-proximal DNA region was cloned into the lacZ transcriptional fusion vector pRW50 and then transformed into the WT or Δcrp strain to determine the promoter activity, i.e., the β-galactosidase activity (miller units) in the cellular extracts. (D) EMSA. The radioactively labeled promoter-proximal DNA fragments were incubated with increasing amounts of a purified His-CRP protein and then subjected to 4% (w/v) polyacrylamide gel electrophoresis. The band of free DNA disappeared with increasing amounts of His-CRP, resulting in a DNA band with decreased mobility, which presumably represented the DNA-CRP complex. Shown also is a schematic representation of the EMSA design. A DNA fragment from the coding region of the 16S rRNA gene served as a negative control. (E) DNase I footprinting. Labeled coding or non-coding DNA probes were incubated with increasing amounts of purified His-CRP and then subjected to a DNase I footprinting assay. The footprint regions are indicated with vertical bars.

