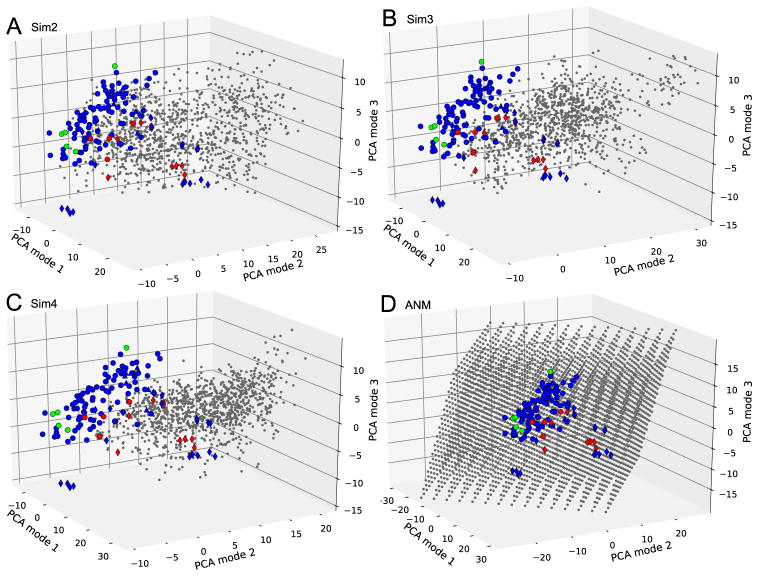
Fig. 3. Projections of MD and ANM ensembles onto the subspace spanned by the reference modes PC1-PC3.
Ensembles from Sim2, Sim3, Sim4, and ANM are shown in panels A, B, C, and D, respectively. PDB structures are marked as in Fig. 2. Conformations generated by computations are shown by gray points. The perspective is the same in all panels for ease of comparison.

