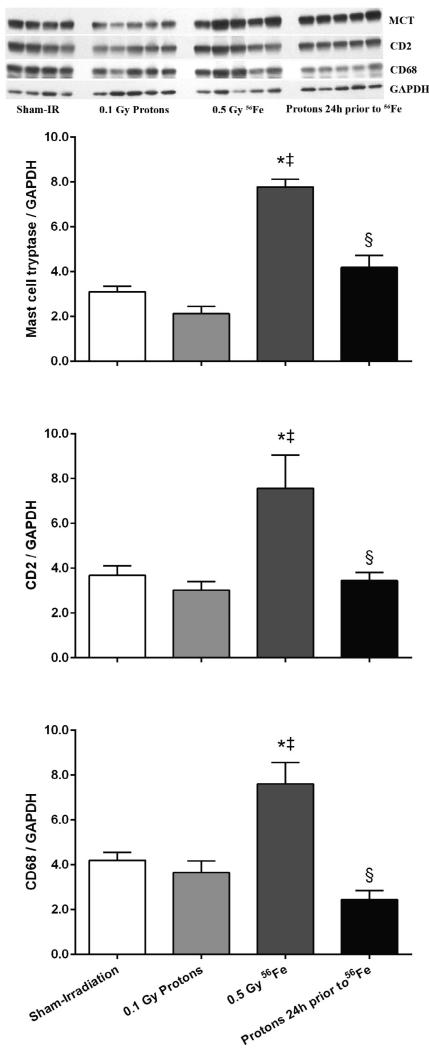
Figure 3.
Increased expression of markers of cardiac inflammatory cells indicated that 56Fe exposure led to increased numbers of mast cells (mast cell tryptase, MCT), T-lymphocytes (CD2), and monocytes/macrophages (CD68). No alterations in these markers were observed in the consecutive exposure group. Western-blot image indicates 4-5 biological repeats in each radiation group. Graphs indicate average ± SEM, n=4-5. Quantification of MCT/CD2/CD68 divided by GAPDH for sham-irradiation: 3.10 ± 0.24/3.68 ± 0.43/4.21 ± 0.35; for 0.1 Gy protons: 2.12 ± 0.33/3.02 ± 0.38/3.65 ± 0.51; for 0.5 Gy 56Fe: 7.78 ± 0.35/7.56 ± 1.48/7.61 ± 0.96; for the consecutive exposure group: 4.19 ± 0.53/3.44 ± 0.37/2.45 ± 0.39. *p<0.05 compared to sham-irradiated control, ‡p<0.05 compared to proton exposure, §p<0.05 compared to 56Fe exposure.

