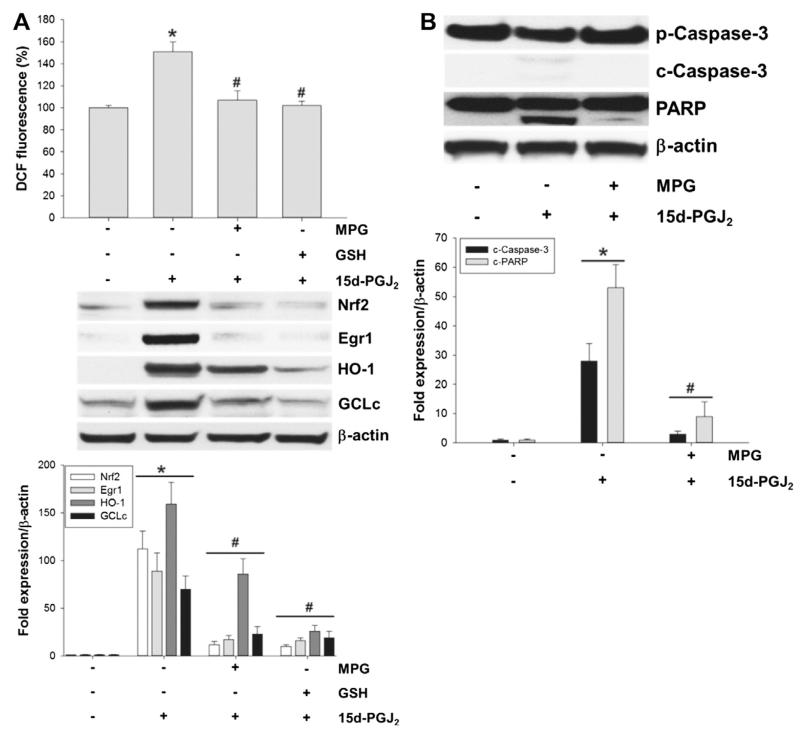
Fig. 9.
Effect of GSH and MPG on the Nrf2/Egr1-HO-1/GCLc axis and cell death induced by 15d-PGJ2. MG-63 cells were treated with (A/B) MPG or (A) GSH ethyl ester (termed GSH) for 30 min or prior to 15d-PGJ2 treatment (20 μM) for 15 min (A, upper panel), 6 h (A, middle panel) or 24 h (B) to follow (A, upper panel) ROS generation by measuring DCF fluorescence and expression of (A, middle panel) Nrf2, Egr1, HO-1 and GCLc, and (B) apoptotic markers using Western blot analysis. β-Actin was used as a loading control. One representative blot out of three is shown. Densitometric evaluation of immunoreactive bands is given below (A/B [lower panel]). (A) DCF fluorescence intensity of vehicle (0.1% DMSO)-treated cells was set 100% and values are expressed as mean ± SEM (n = 6). *p ⩽ 0.05 vs. control and #p ⩽ 0.05 vs. 15d-PGJ2. Pro-Caspase-3 (p-Caspase-3); cleaved Caspase-3 (c-Caspase-3). Poly (ADP-ribose) polymerase (PARP; uncleaved and cleaved forms).

