
Figure 3.
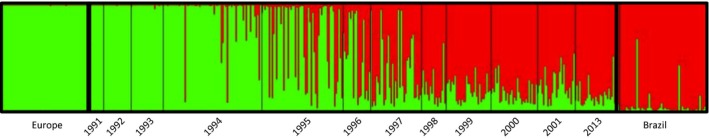
Assignment of individual honey bees inferred from 12 microsatellite loci using the software STRUCTURE. Each of the 456 individuals included in the analysis is represented by a vertical bar partitioned into two (K = 2) segments, represented by green and red, corresponding to membership proportions in each of the two optimal K clusters, as estimated by Evanno's ΔK (Evanno et al. 2005). Black lines separate honey bee samples from the Welder Wildlife Refuge, San Patricio County, TX, by year (from 1991 to 2001, and 2013) and the reference samples from Europe (green) and Brazil (red).