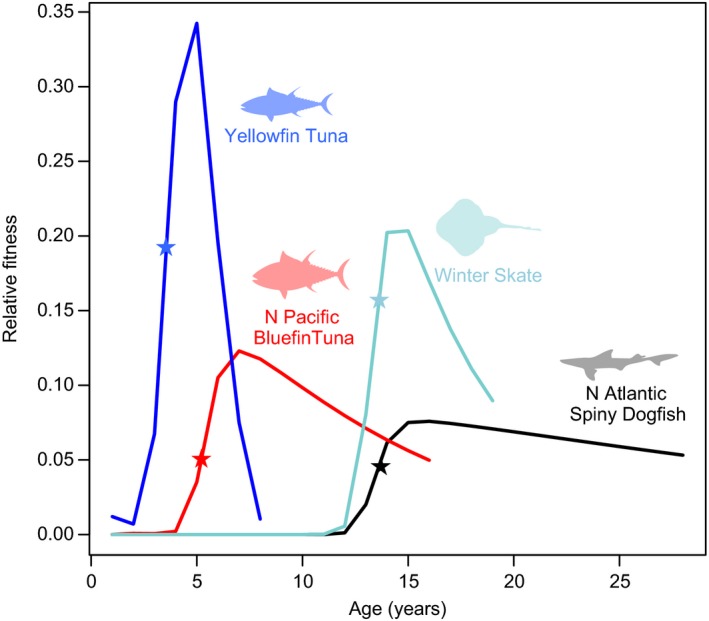
Box 2 Figure 1.

The relative fitness (the contribution of each age class to reproductive value) for four species with contrasting life histories. Mean age at maturity for each species is noted with a ★. Curves are generated from simulations based on published growth, mortality, and life‐history parameters; each curve represents the expected fitness of each age class, scaled by total births in a steady state population. For each species, mean fecundity is known – from this, the relationship between fertility and age was assumed to be proportional to body size at age. Data and supplementary graphs are in Appendix S3.
