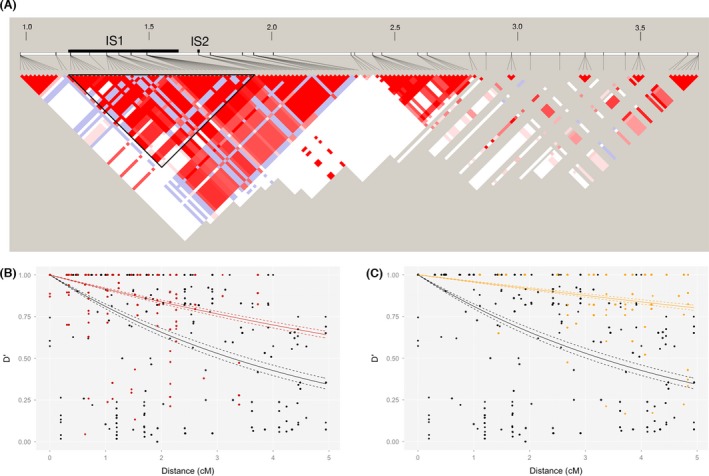
Figure 6.

(A) Linkage disequilibrium (D′) around the introgression site on LG17. Color intensity indicates the value of D′. Red colors indicate LOD ≥2, whereas blue colors indicate LOD < 2. Bold black lines above the LD data indicate two introgression sites, IS1 and IS2. The triangle surrounded by a bold black line indicates LD within IS1. The numbers on the panel indicate the position on LG17 in Mb. Only LD between loci with the distance of <1 Mb are shown here. (B) LD decays more slowly within the introgression site IS1 (red) than outside IS1 (black). (C) Decay of LD between a marker within IS1 and a marker outside IS1 (orange) was also slower than the LD decay between markers outside IS1 (black). Dotted lines indicate 95% confidence intervals.
