
Figure 3.
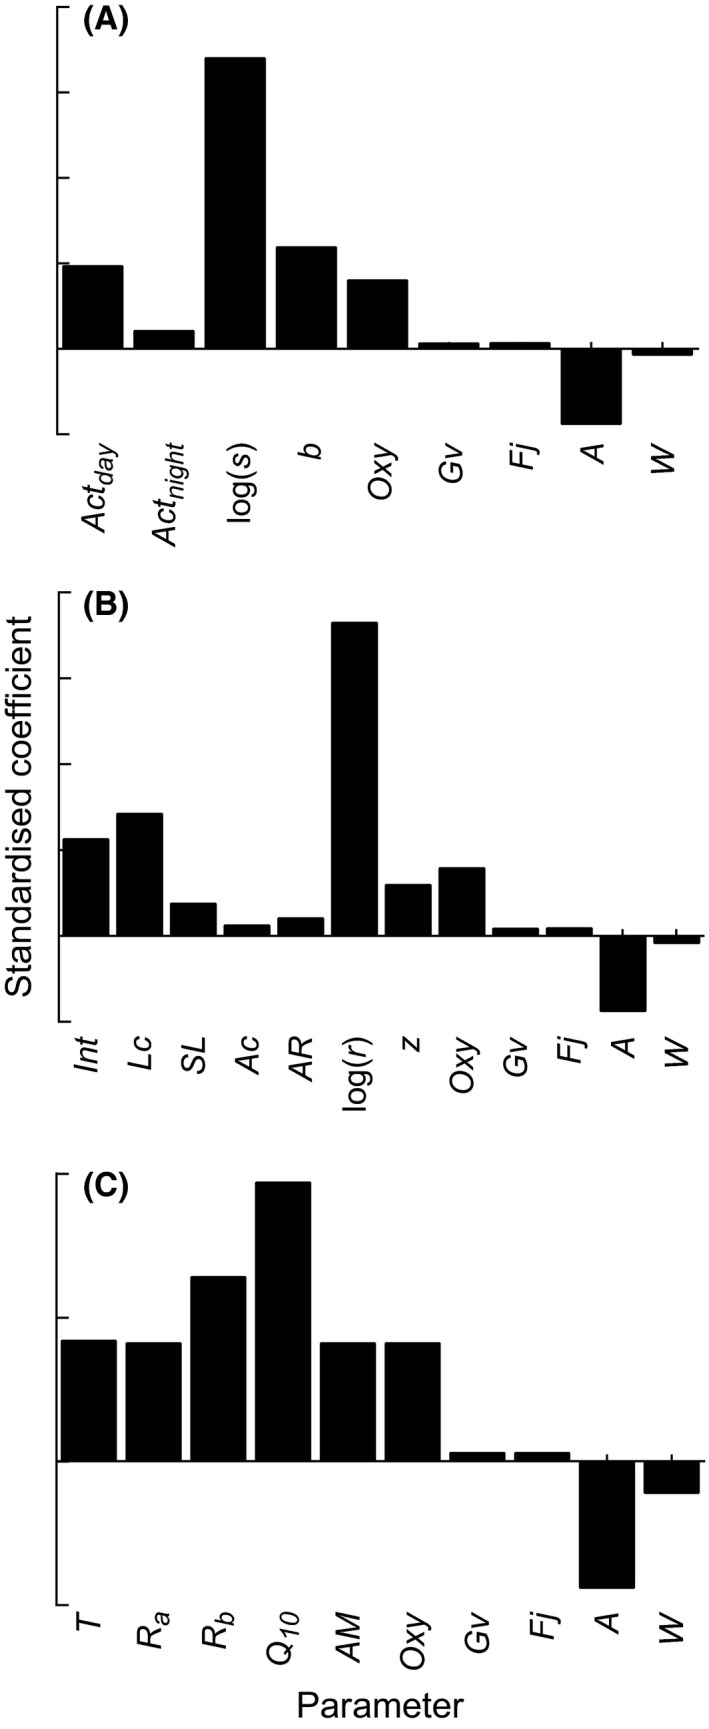
Results of sensitivity analysis for three models that estimate consumption rates of kingfish: (A) accelerometry model; (B) morphometric model; (C) physiological model. Bars are the coefficients of the multiple regression of standardized simulation data, and represent the relative influence of each parameter on modeled consumption rate. See Table 2 for parameter definitions.