
Fig. 4.
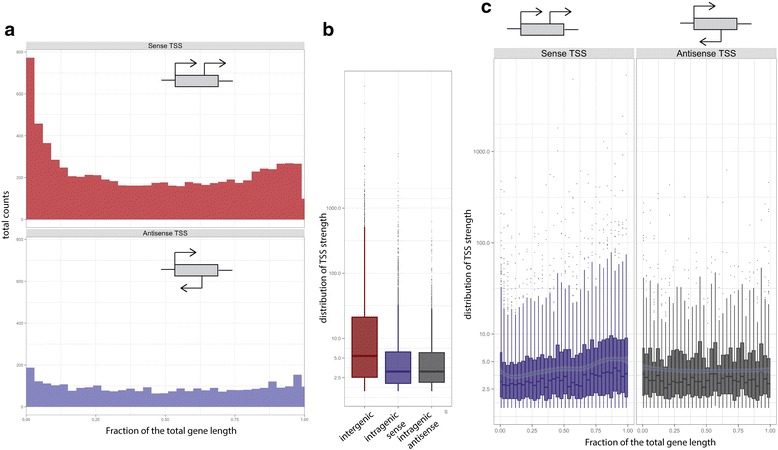
Intragenic TSS. a Distribution of the number of sense and antisense intragenic TSS as a function of the position within genes. b Box plot representing the distribution of the TSS strength (RRS score) for intergenic (red), sense intragenic (blue) and antisense intragenic (grey) TSS. c Distribution of intragenic sense (blue) and antisense (grey) TSS strength as a function of their position within genes