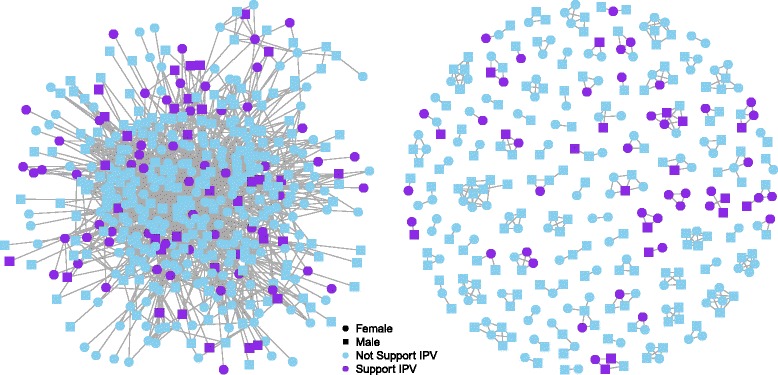
Fig. 2.

Shows one village’s network from 2 perspectives. The left panel depicts all ties from a randomly selected group of individuals. Note that IPV acceptance is clustered among socially connected individuals and that IPV is generally more accepted on the periphery of the network. The right panel depicts only within household ties from the same randomly selected group. Note the strong clustering of IPV norms at the household level
