
Fig. 2.
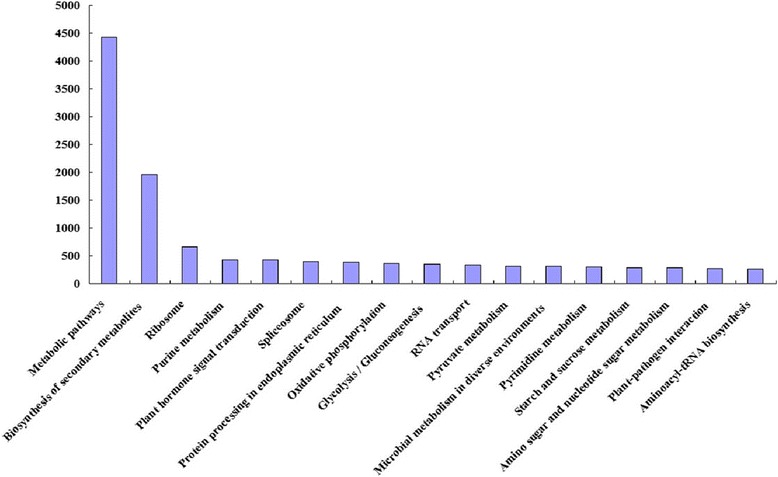
KEGG-enrichment analysis in C. korshinskii. The Y-axis indicates the numbers of contigs enriched in KEGG pathways. The X-axis represents contigs enriched in different metabolic pathways
Official websites use .gov
A
.gov website belongs to an official
government organization in the United States.
Secure .gov websites use HTTPS
A lock (
) or https:// means you've safely
connected to the .gov website. Share sensitive
information only on official, secure websites.
KEGG-enrichment analysis in C. korshinskii. The Y-axis indicates the numbers of contigs enriched in KEGG pathways. The X-axis represents contigs enriched in different metabolic pathways