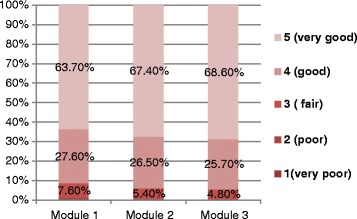
Fig. 2.

Distribution of participants’ rating for quality of three course modules. This means 91.3, 93.9 and 94.3 % of the participants rated the quality of module 1, module 2 and module 3 as “good” or “very good”; only 1.2, 0.8 and 0.9 % rated module 1, module 2 and module 3 respectively as “poor” or “very poor”
