
Fig. 5.
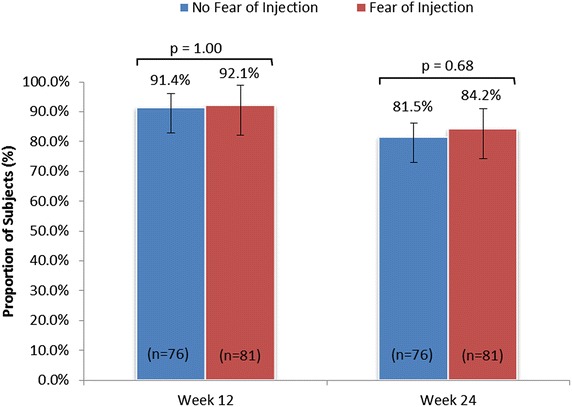
Proportion of participants with ≥80 % treatment adherence according to fear of injection at weeks 12 and 24 (mITT population). p value assessed via Fisher’s exact test. mITT modified intent-to-treat
Official websites use .gov
A
.gov website belongs to an official
government organization in the United States.
Secure .gov websites use HTTPS
A lock (
) or https:// means you've safely
connected to the .gov website. Share sensitive
information only on official, secure websites.
Proportion of participants with ≥80 % treatment adherence according to fear of injection at weeks 12 and 24 (mITT population). p value assessed via Fisher’s exact test. mITT modified intent-to-treat