Fig. 8.

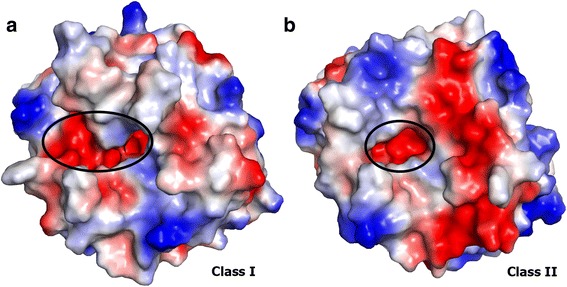
Electrostatic surface charge distribution of Class I and II SMases D highlighting the catalytic interface. The ellipses indicate the active-site pocket. a Class I; b Class II

Electrostatic surface charge distribution of Class I and II SMases D highlighting the catalytic interface. The ellipses indicate the active-site pocket. a Class I; b Class II