
Fig. 3.
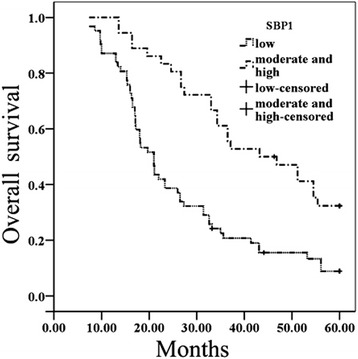
Kaplan–Meier survival plots for LSCC patients according to the expression levels of SBP1. SBP1 expression and overall survival (P = 0.000). P value was determined using a two-sided log-rank test
Official websites use .gov
A
.gov website belongs to an official
government organization in the United States.
Secure .gov websites use HTTPS
A lock (
) or https:// means you've safely
connected to the .gov website. Share sensitive
information only on official, secure websites.
Kaplan–Meier survival plots for LSCC patients according to the expression levels of SBP1. SBP1 expression and overall survival (P = 0.000). P value was determined using a two-sided log-rank test