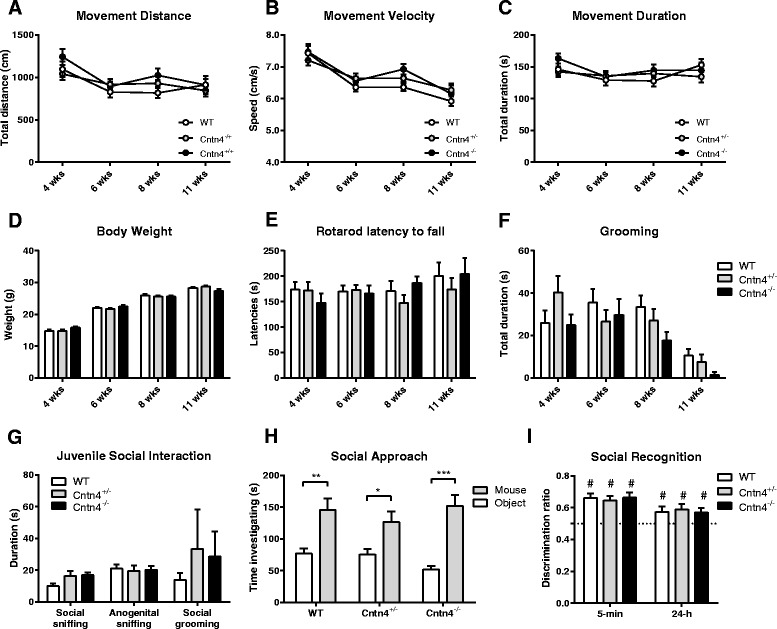
Fig. 1.

Developmental neurological and behavioral screen and analysis of social behaviors in Cntn4-deficient mice. a Distance moved (rmANOVA genotype, F (2,63) = 0.760, p = .472), b movement velocity (rmANOVA genotype, F (2,63) = 1.256, p = .292), c movement duration (rmANOVA genotype, F (2,63) = 0.342, p = .479), d body weight (rmANOVA genotype, F (2,63) = 0.588, p = .558), e latency to fall of the accelerating rotarod (rmANOVA genotype, F (2,64) = 0.110, p = .896), and f time spent self-grooming (rmANOVA genotype, F (2,64) = 1.038, p = .360) at pre-adolescence (4 weeks), adolescence (6 weeks), early adulthood (8 weeks), and adulthood (10 weeks) (n = 19–26 per genotype) during the eSHIRPA test. g Social sniffing (owANOVA, F (2,16) = 2.926, p = .083), anogenital sniffing (owANOVA, F (2,16) = 0.055, p = .946), and social grooming (owANOVA, F (2,16) = 0.334, p = .721) during the juvenile social interaction test in genotype-matched mice at post-natal day 21 (n = 6–7 pairs of genotype-matched interacting animals per genotype). h Social exploration (owANOVA between genotypes, F (2,32) = 0.599, p = .556) as a function of exploration of the cage with the novel mouse versus the empty cage during the three-chamber task (n = 12 per genotype). i Social exploration during the social discrimination test following a 5-min inter-trial interval (owANOVA between genotypes F (2,36) = 0.138, p = .872) and a 24-h inter-trial interval (owANOVA between genotypes F (2,36) = 0.096, p = .909), with exploration of the novel mouse as fraction of the total duration of social exploration (n = 10–15 per genotype). Data are presented as means ± SEM. *p < 0.05; **p < 0.01; ***p < 0.001; #p < 0.05
