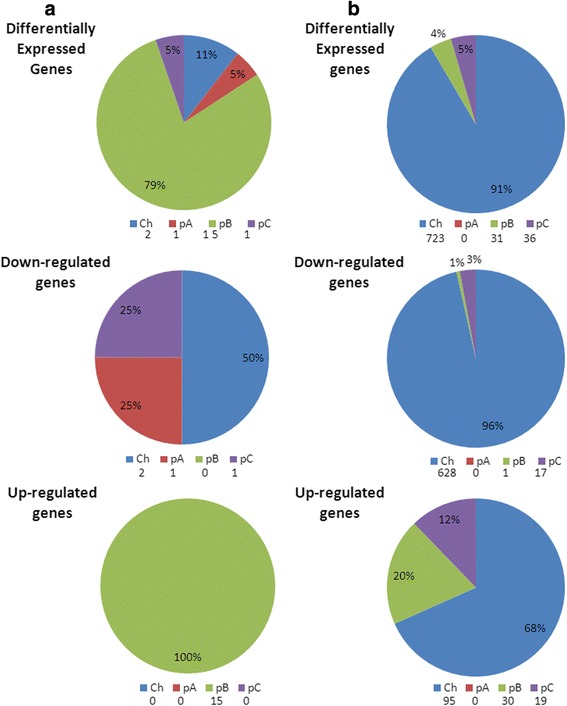
Fig. 1.

Distribution of differentially expressed genes. Percentage and location of differentially expressed genes (up- and down-regulated) in R. tropici CIAT 899 induced with apigenin (a) or salt (b). Ch: chromosome, pA: pRtrCIAT899a, pB: pRtrCIAT899b, pC: pRtrCIAT899c. The number of differentially expressed genes is indicated under each replicon
