
Fig. 2.
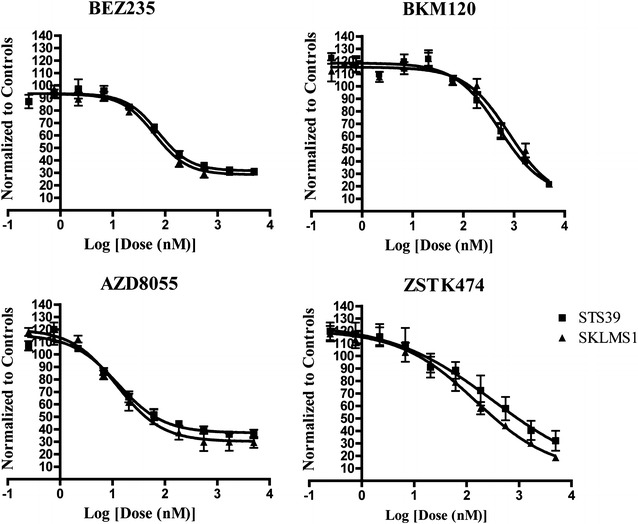
Secondary validation of selected hits discovered in primary screen in LMS cell lines. Treatment of SKLMS1 and STS39 cell lines with four inhibitors using a 10-point, threefold serial dilution, generating EC50 curves ranging from 0.25 to 5000 nM. Cells were incubated for 72 h and cell viability quantified with ATPlite (n = 3)