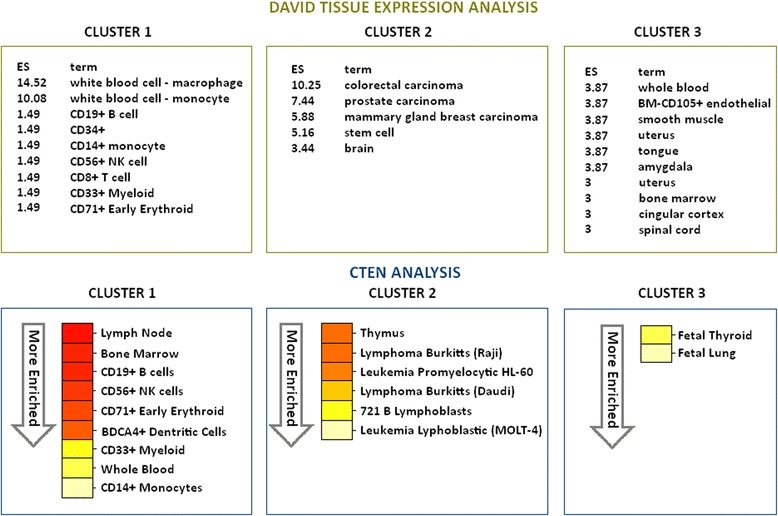
Fig. 5.

Cell type enrichment analyses of genes identified as the three largest clusters from BE3D. For DAVID, enrichment scores (ES) are shown in front of specific cell types. For CTEN, from red to light yellow are all significant enriched cell-types within each cluster transcript list (enrichment score ≥ 2.0), going from enriched to most enriched
