
Table 3.
Overview of modules of DE genes whose eigengene is significantly correlated with WUR genotype
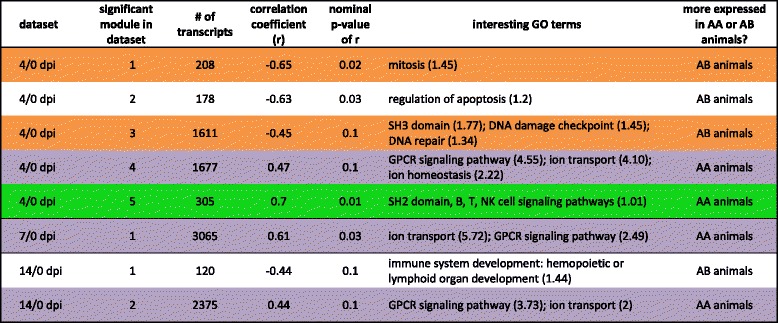
The table here presented shows immune-related GO enrichment across time-points. For 4/0 dpi, 7/0 dpi, 10/0 dpi and 14/0 dpi comparisons the significant modules (p ≤ 0.10) are listed together with the number of transcripts, the correlation coefficient with WUR genotype, the nominal p-value for that correlation and the interesting Gene Ontology (GO) terms, with enrichment scores in brackets. Positive correlation coefficients point to modules that contain transcripts that are more highly expressed in AA than in AB animals. Negative correlation coefficients refer to modules with transcripts that are more highly expressed in AB animals. Rows are color-coded according to their agreement with GO terms in clusters formed by BioLayout Express3D (BE3D): green for cluster 1, orange for cluster 2, purple for cluster 3