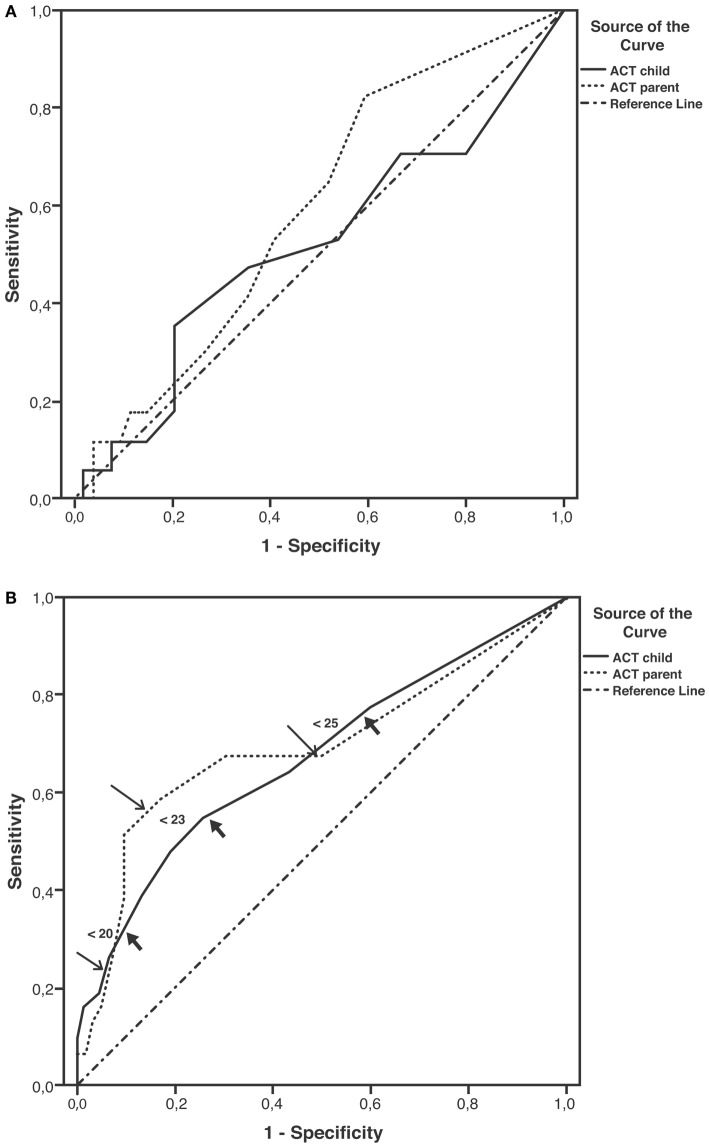
Figure 2.
Receiver operating characteristic (ROC) curves for ACT scores as predictors of EIB. (A) Patients aged under 12 years; areas under curves (AUCs): child: 0.52, p = 0.814; parent: 0.59, p = 0.255. (B) Patients aged ≥12 years; AUCs: child: 0.67, p = 0.007; parent: 0.69, p = 0.002; thick arrows (child) and thin arrows (parent) indicate predictive values for ACT scores below 20, 23, and 25 (detailed in Table 4).

