
Fig. 6.
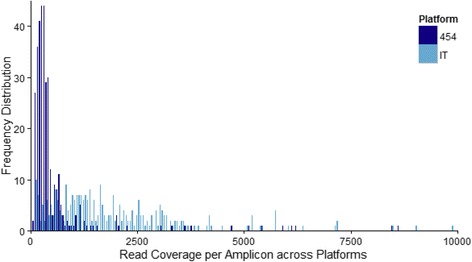
Frequency distribution of final read coverage per amplicons. The read coverage for each of the two sequencing platforms is shown: 454 Titanium [dark blue] and Ion Torrent PGM [light blue]. Because few amplicons had > 10,000 reads [n = 7], only the distribution of amplicons with < 10,000 reads are shown