
Fig. 2.
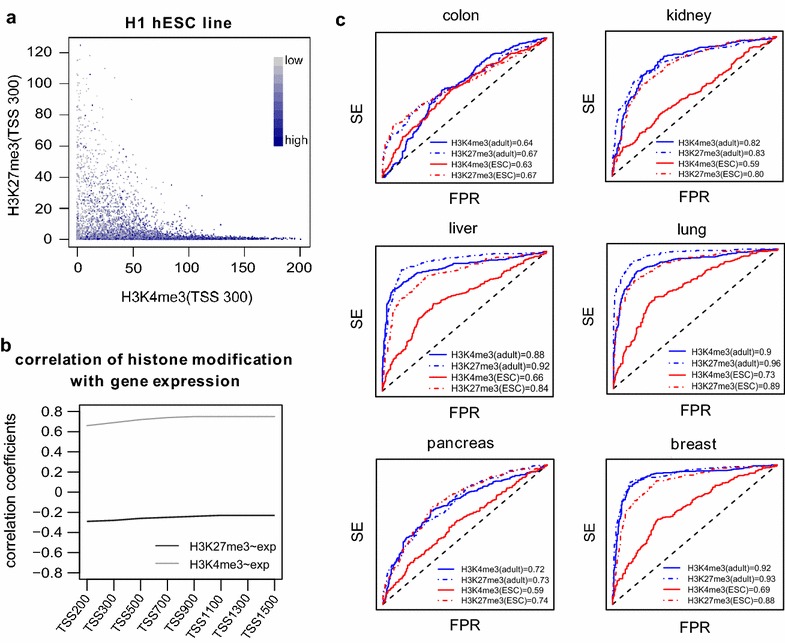
Prediction of tissue-specific cancer DNAm patterns from bivalent marks in normal cells. a Scatter plot shows the association between gene expression with promoter H3K4me3 (x-axis) and H3K27me3 (y-axis) occupancy. b Pearson's correlation coefficients calculated between promoter H3K4me3 and H3K27me3 modification with corresponding gene expression levels in H1 hESC line, as function of the window size (bp) centered at the TSS over which the signal is estimated. c ROC-AUC analysis assessing the predictive potential of cancer-associated hypermethylation at unmethylated GPs in normal tissue from H3K4me3 and H3K27me3 promoter signals in normal tissue and hESC cells, as indicated. Each panel is for a given tissue and cancer type