
Fig. 2.
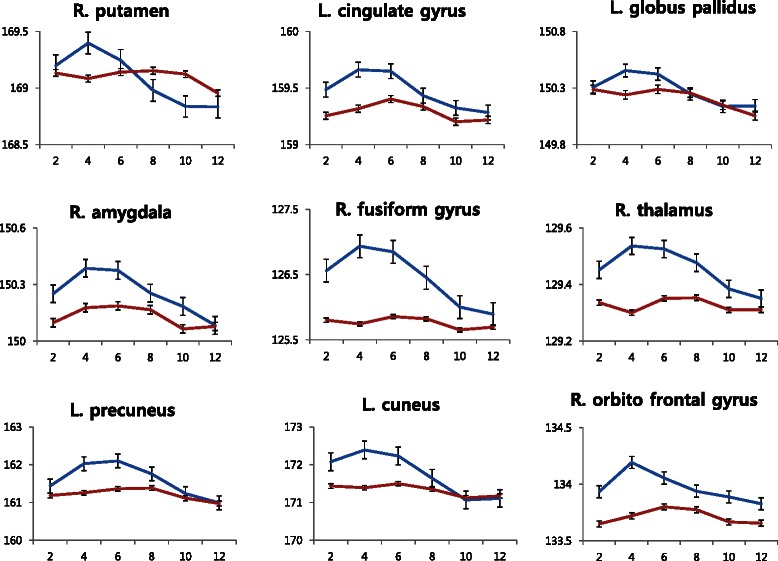
Hemodynamic responses between the sexual stimuli and nonsexual stimuli conditions in the regions of interest. The fitted data are shown as changes in blood oxygen level-dependent signal over time. Values are the mean ± SEM. The y-axis and x-axis are expressed in arbitrary units and seconds. R right, L left, blue, the response of sexual condition, red the response of nonsexual condition