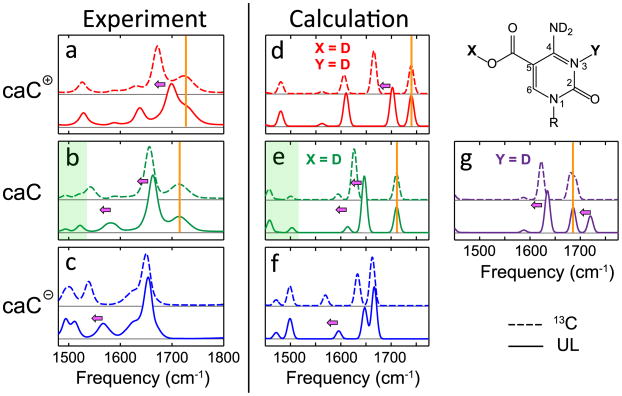
Figure 6.
Comparison between the experimental (left) and DFT calculated (right) spectra for 5caC cation (red), neutral (green/purple), and anion (blue) species. Both unlabeled (solid lines) and 13C labeled (dashed lines) 5caC spectra are shown. Pink arrows highlight frequency shifts upon isotopic labeling, while orange bars highlight frequencies that are unaffected by the label.

