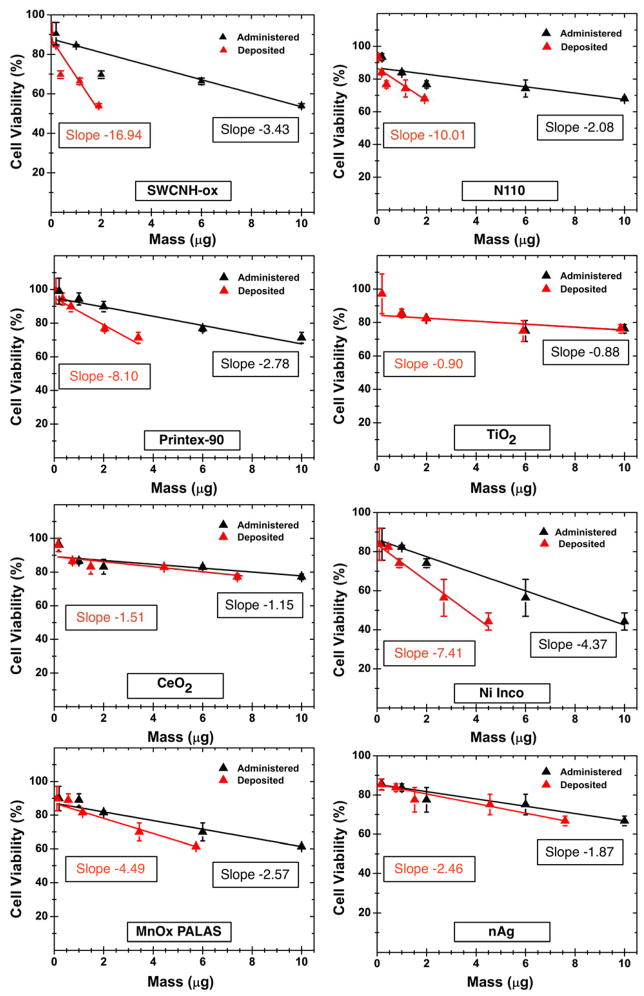
Figure 6.
MTT cell viability assay toxicity results as a function of administered and deposited dose for all ENMs dispersed in RPMI+10% FBS at 24h. Fitted lines for most ENM had an R2 of 0.9 or better; for N110 (R2 =0.8), and CeO2 and TiO2 (R2 ~0.65). The delivered dose estimates were derived from the VCM-ISDD model calculations with effective density measurements (Hinderliter et al 2010; Cohen et al 2014) reported in table 3. Reproduced in parts with permission from Pal et al. ACS Nano, 2014, 8 (9), pp 9003–9015.

