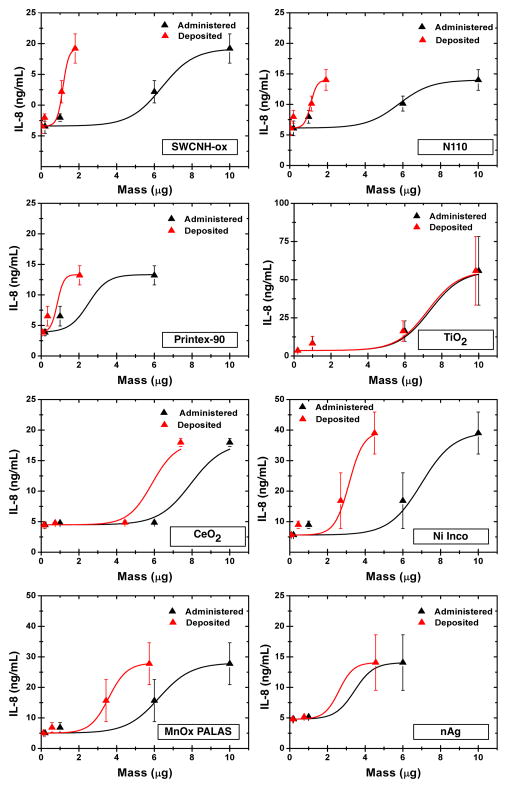
Figure 7.
Dose-response relationship for pro-inflammatory cytokine IL-8 as function of administered and deposited dose over the 1–50μg/mL range. The R2 of fitted lines was >0.95 for all curves. Slopes used in Table 5 were determined from the Origin software. For Printex-90 and nAg, the IL-8 concentrations at the highest 50 μg/mL dose were above the upper detection limit of the instrument. As reported in the literature, it is possible that the high production rate and much higher variability in IL-8 concentrations may be a result of competing factors: either interaction of ENM with IL-8 and/or due to high ENM cell toxicity. The delivered dose estimates were derived from the VCM-ISDD model calculations with effective density measurements (Hinderliter et al 2010; Cohen et al 2014) reported in table 3.

