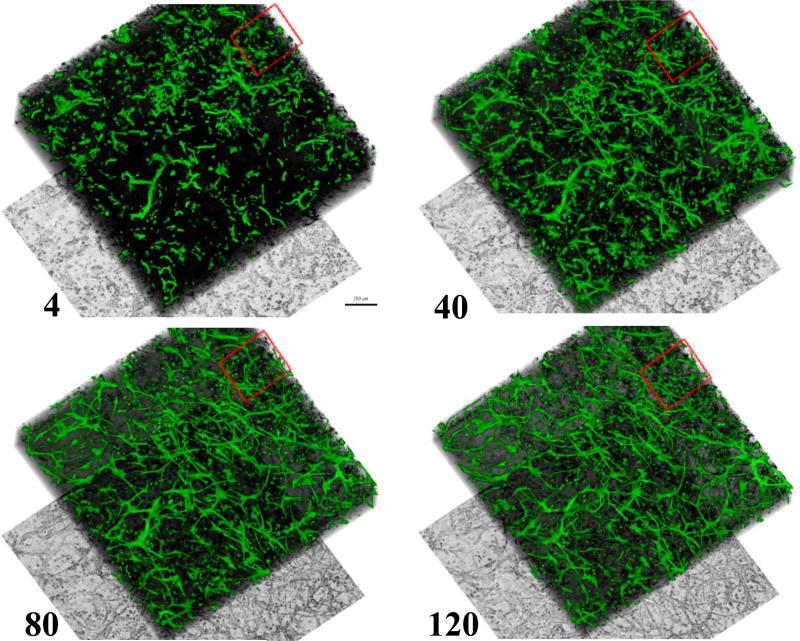
Figure 2.
Full field of view of microvessel culture undergoing sprouting and neovessel formation during 5 days of incubation. Numbers indicated the time points in hours after start of microscopy. Green: EGFP; black: collagen SHG; bottom: minimum projection of laser transmission resembling a phase contrast image. Scale bar = 250 microns. Red square illustrates region of interest for subsequent figures. Neovessels formed uniformly throughout the culture.

