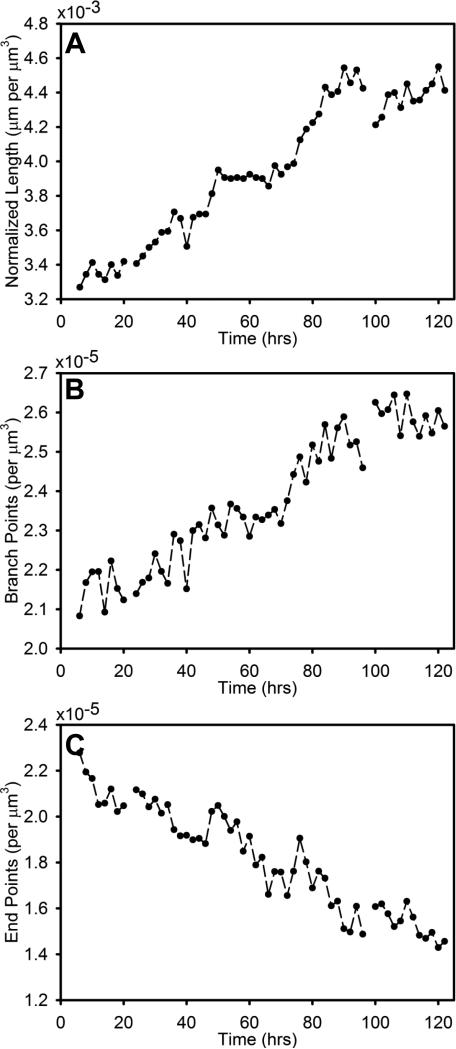
Figure 3.
Morphometric data measured over the entire imaged domain of one of the Circular Constrained datasets. (A) - Total vascular length, representing the sum of the length of all neovessel segments. (B) – Total number of branch points (sites of branching and anastomosis). (C) – Total number of end points (vessel free ends). Morphometric data was normalized by the volume of the imaged domain to account of contraction during the time series experiment. Missing data points are due to issues with the image acquisition, which occurred during the media case in one instance.

