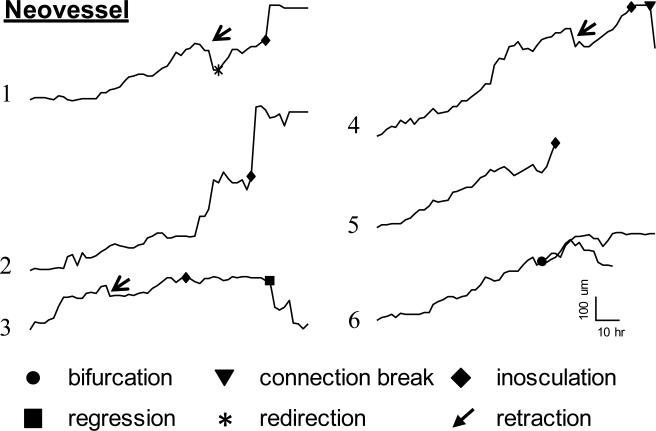
Figure 5.
Length tracings of individual growing neovessels indicating total neovessel length (y-axis) over time (x-axis) over a 5 day period. Neovessel 1 is the tracing of the neovessel illustrated in Fig. 6. Advancement of the sprouts is episodic with phases of growth punctuated by retraction (rapid, brief shortening) or regression (shortening without further growth).

