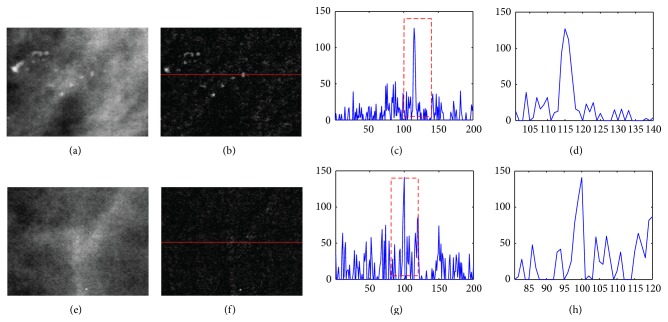
Figure 5.
Comparison of intensity profile between microcalcification and mammary gland. (a) Microcalcifications in original mammogram image. (b) The result of the top-hat transform of (a). (c) Intensity profile of a row in (b). (d) Expanded view of the dashed rectangle in (c). (e) Mammary glands in original mammogram image. (f) The result of the top-hat transform of (e). (g) Intensity profile of the row in (f). (h) Expanded view of the dashed rectangle in (g).

