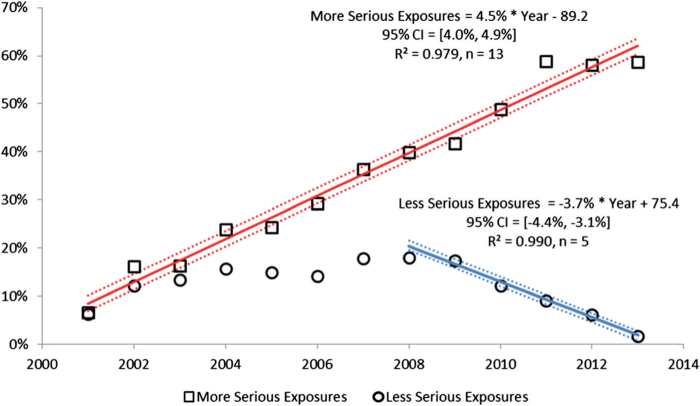
Figure 4.
Change in encounters by outcome from 2000. The figure shows the percent change from baseline for Human Exposure Calls divided among the 10 Medical Outcomes. The More Serious Exposures (Major, Moderate, and Death) increased. The Less Serious Exposures (no effect, minor effect, not followed (non-toxic), not followed (minimal toxicity possible), unable to follow (potentially toxic), and unrelated effect) decreased after 2008. Solid lines show least-squares linear regressions for the change in More Serious Exposures per year (□) and Less Serious Exposures (○). Broken lines show 95% confidence interval on the regression (colour version of this figure can be found in the online version at www.informahealthcare.com/ctx).

