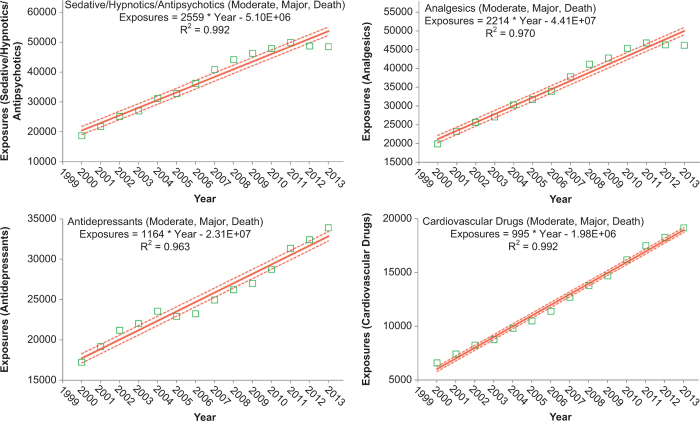
Figure 5.
Substance Categories with the Greatest Rate of More Serious Exposure Increase (Top 4). Solid lines show least-squares linear regressions for More Serious Human Exposure Calls per year for that category ( ). Broken lines show 95% confidence interval on the regression. More Serious Exposures include Medical Outcome of Moderate, Major and Death (colour version of this figure can be found in the online version at www.informahealthcare.com/ctx).

