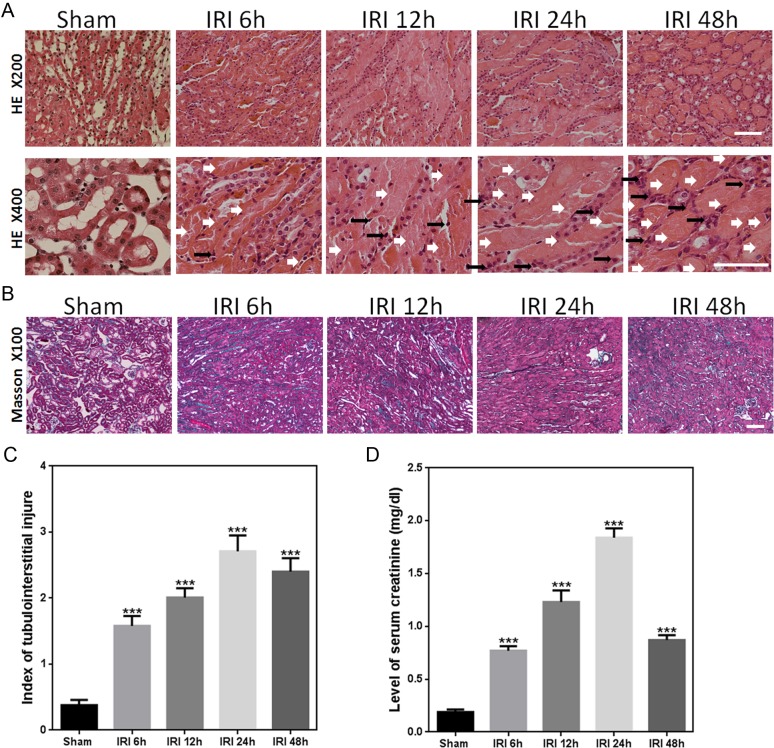
Figure 1. IRI caused substantial changes in renal morphology and function.
(A) Representative light microscopy images of HE-stained sections of renal outer medulla from the sham and IRI groups at 6, 12, 24, and 48 h (magnification of the upper row, 200× (bars = 250 µm); magnification of the lower row, 400× (bars = 200 µm)). White and black arrows indicate injured tubular and infiltrated inflammatory cells, respectively. (B) Representative light microscopy images of Masson-stained sections of renal outer medulla from the sham and IRI groups at 6, 12, 24, and 48 h (magnification, 100×; bars = 250 µm). (C) Graph showing the score of renal tubular injury in every group. ∗∗∗p < 0.0001 versus sham; magnification, 200×n = 8; (D) Serum creatinine levels at 6, 12, 24, and 48 h after unilateral IRI and in the sham group. ∗∗∗p < 0.0001 versus sham; n = 8.

