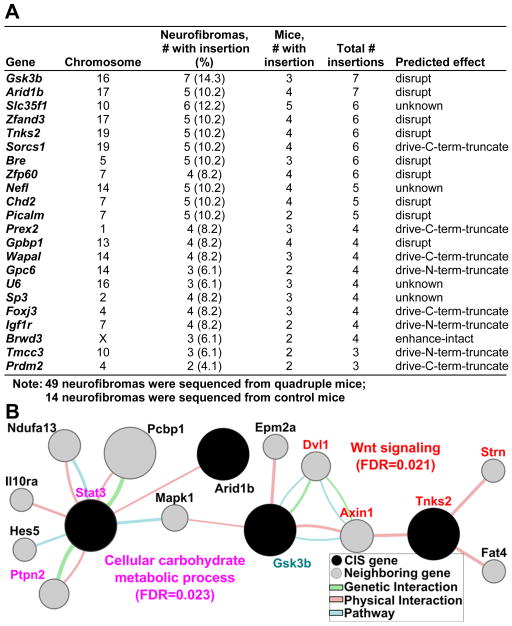
Figure 1. Genes identified by Sleeping Beauty Transposon System predict STAT3 and WNT pathway activation in neurofibroma.
(A) Common insertion sites (CIS) identified from neurofibromas. The positions were based on the Ensembl NCBI m37 April 2007 mouse assembly. (B) Genemania pathway analysis using 22 CIS (black) and 20 genes (grey) connected to CIS by genetic, physical or pathway analysis identifies two significantly deregulated networks. WNT signaling related gene names are shown in Red and Cellular carbohydrate metabolic process related genes are in pink. GSK3b (turquoise) connects these pathways to those in Supplemental Figure 2. Circle size correlates to network association probabilities.

