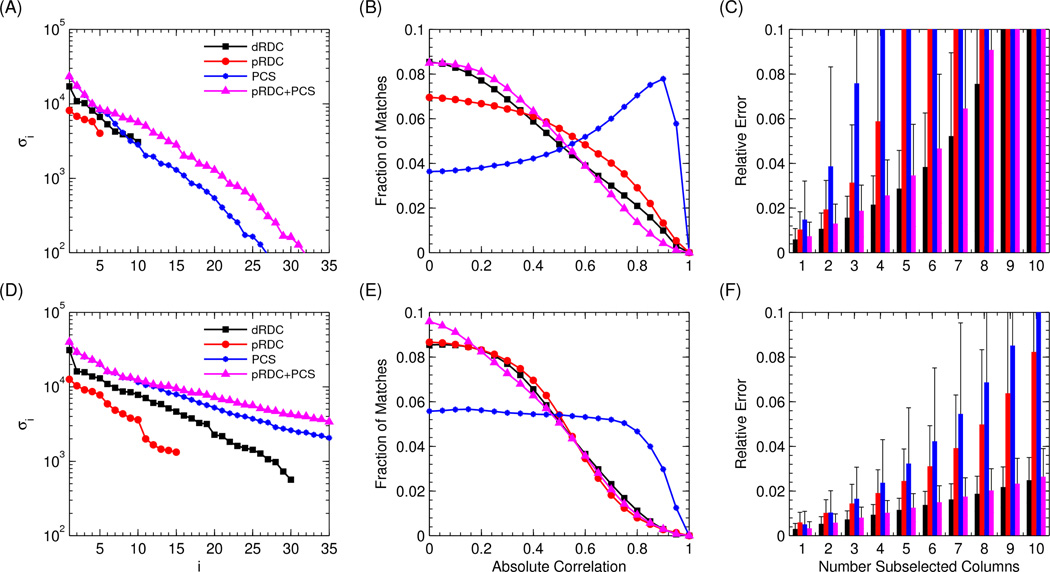
Figure 2.
SVD decomposition (left panels), histogram of column correlations (center panels), and condition number of randomly subselected set of columns (right panels), for the eight described datasets. The results for a single medium/metal ion are shown on the top, and the results for the 3 media/metal ions are shown on the bottom. (A–D) The 35 largest singular values of the associated A matrices. (B–E) The distribution of the uncentered correlations between all pairs of columns in the A matrix, estimated by performing 20000 random samples. (C–F) The expected mean and standard deviation of the relative error for recovering population weights from an arbitrary M=1,…,10 subset of columns.

