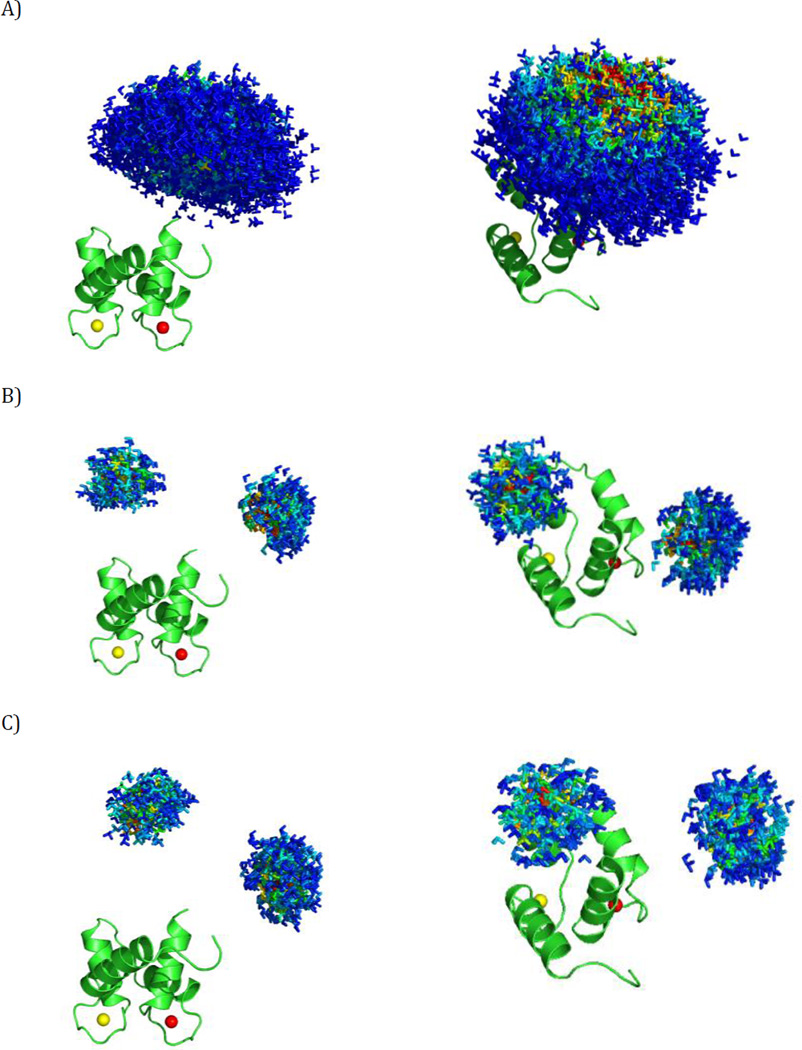
Figure 3.
The simulated ensembles. Different positions of the C-terminal domain of CaM are represented by a triad of Cartesian axes, centered at the center of mass of the C-terminal domain. The conformers are color coded according to their relative weights (form red = high weight to blue = low weight). (A) Simulation 1, (B) Simulation 2, (C) Simulation 3. The ensembles are shown from two different points of view in the left and right panels. All the conformers are superimposed by the N-terminal domain, which is shown in cartoon representation.

