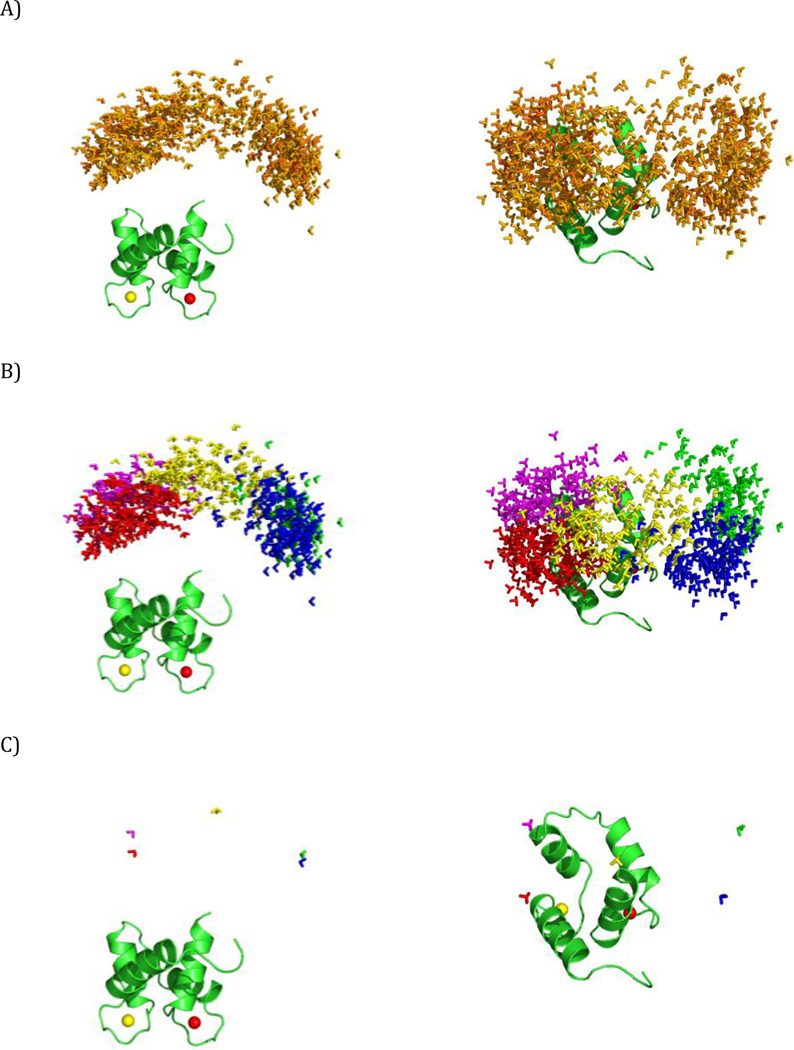
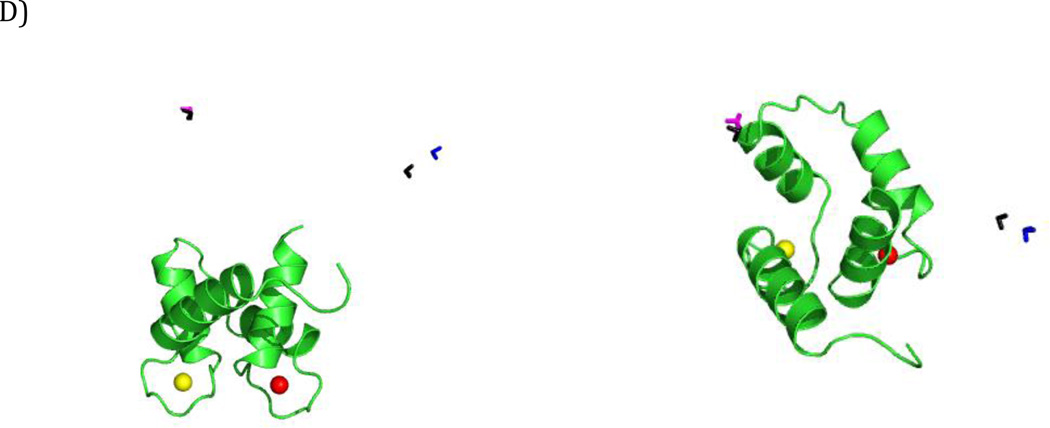
Figure 8.
MaxOcc/MaxOR results for Simulation 2 with paramagnetic data (1 Hz error for pRDC and 0.01 ppm error for PCS). Each conformation is represented by a triad of Cartesian axes, centered at the center of mass of the C-terminal domain. (A) The conformers with the highest MaxOcc, color code – according to the MaxOcc value (0.0-blue, 0.6-red). (B) The five clusters formed by the conformers in panel A. (C) The centers of the clusters. (D) The centers of clusters with the largest MaxOR versus the centers of the simulated regions (black). All conformers are superimposed by the N-terminal domain, shown as a ribbon.


