
Fig. 1.
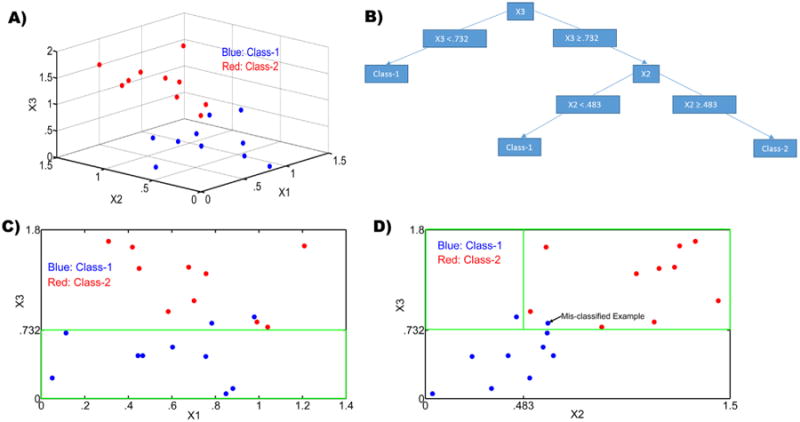
(A) The input feature space for our toy example showing a scatter plot of the three variables X1, X2 and X3 for two classes (shown in red and blue); (B) The decision tree obtained for the data in the toy example shown in A; (C) A projection of the data in A onto the X1–X3 plane. The green box corresponds to the feature space for the left arm of the decision tree in Fig. 1B, i.e., X3 < .732. It can be seen all that class-1 features (blue) are correctly classified; and (D) A projection of the data in A onto the X2-X3 plane. The green box corresponds to the feature space for the right arm of the decision tree in Fig. 1B, i.e., X3 < .732 & X2 < .483 and X3 < .732 & X2 > .483. It can be seen that a class-1 feature (blue) is correctly identified for X3 < .732 & X2 < .483 while another class-1 feature (blue) is mis-classified along with class-2 features for X3 < .732 & X2 > .483.