
Fig. 2.
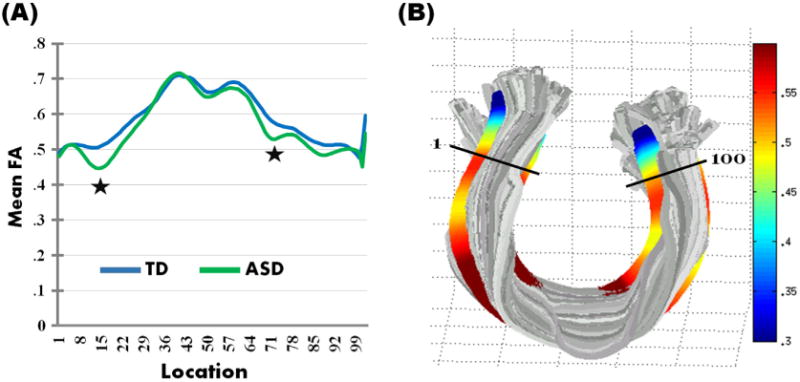
(A) Group means for fractional anisotropy (FA) for the nodes along the forceps minor of the corpus callosum for the TD (depicted in blue) and ASD (depicted in green) groups. The clusters with significant reduction in FA in ASD participants (p < .05, corrected) are indicated with a star; (B) A rendering of FA measurements for the forceps minor of the corpus callosum for one subject as a visualization of the tract properties. The tract segmentation was based on the previously defined Mori white matter atlas (Hua et al., 2008; Wakana et al., 2007).