
Fig. 4.
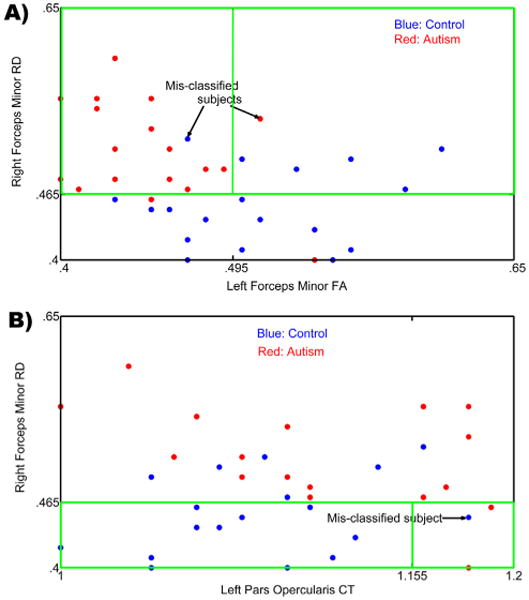
(A) A projection of the input feature space onto a 2D feature space containing the right forceps minor RD and left forceps minor FA as the two axes. The highlighted green box indicates the region in the feature space being utilized for classification which corresponds to the right side of the decision tree in Fig. 3. Blue indicates TD control participants and Red indicates ASD participants. Mis-classified subjects are shown using arrows; (B) A projection of the input feature space onto a 2D feature space containing the right forceps minor RD and left pars opercularis CT as the two axes. The highlighted box indicates the region in the feature space being utilized for classification which corresponds to the left side of the decision tree in Fig. 3. Blue indicates TD participants and Red indicates ASD participants. Mis-classified subject is shown using an arrow.