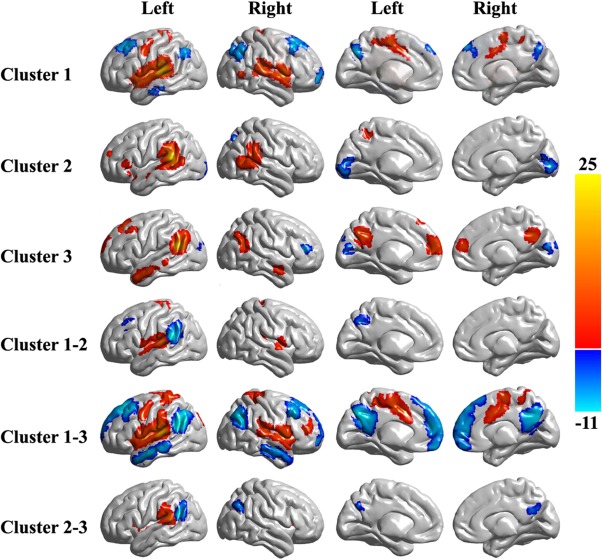
Figure 3.

Whole‐brain RSFC pattern for each cluster and differences in the RSFC patterns between each pair of subregions. The RSFC patterns for each subregion was calculated and one‐sample t‐tests with correction for multiple comparisons were carried out by the family wise error (FWE) method with P < 0.05 and cluster size >30 voxels. Additionally, differences in the RSFC patterns between each pair of subregions were also obtained. And paired t‐tests with corrections for multiple comparisons were carried out by the FWE method with P < 0.05 and cluster size >30 voxels. [Color figure can be viewed in the online issue, which is available at http://wileyonlinelibrary.com.]
