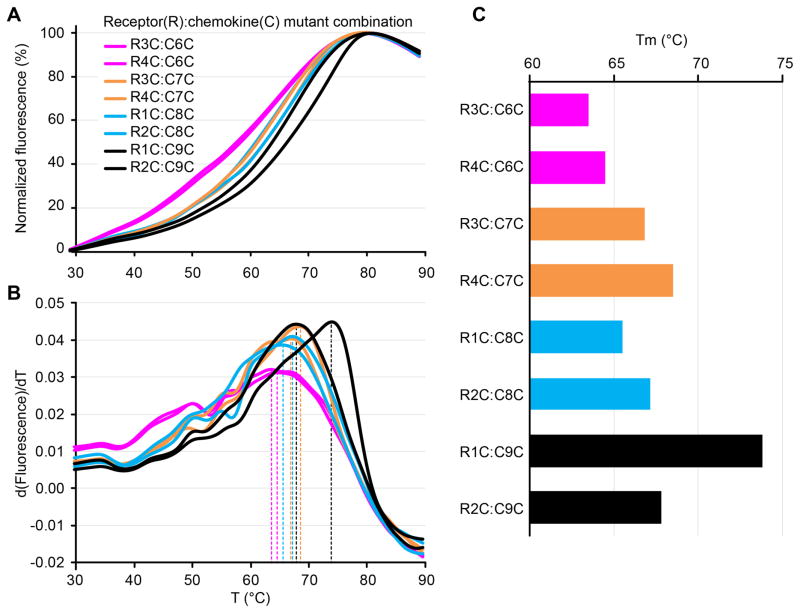
Figure 10.
CPM-DSF characterization of several cysteine mutant pairs for a CC chemokine and its receptor. (A) Melting curves plotting the increasing fluorescence of the CPM dye as a function of temperature. (B) First derivative curves of (A) demonstrate the positions of the peaks used to calculate Tm. (C) Melting temperatures are calculated from the derivative curves. One mutant combination stands out as having a significantly higher Tm.

