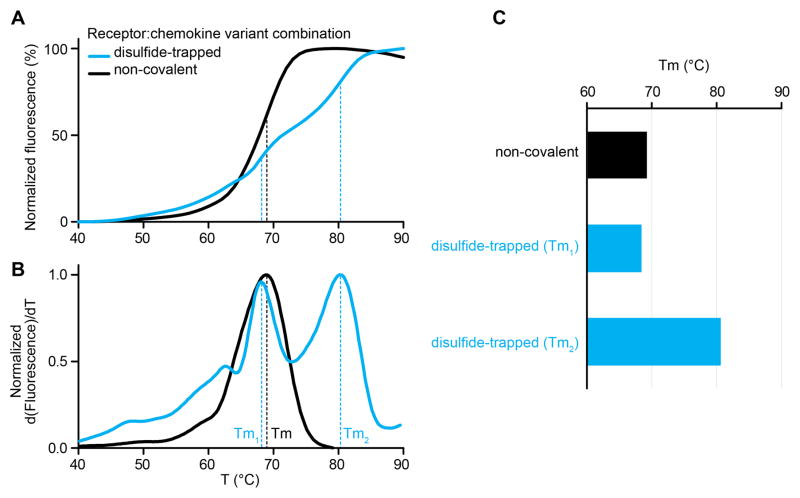
Figure 11.
CPM-DSF characterization of non-covalent and disulfide-trapped complexes of a CXC chemokine and its receptor. (A) Melting curves plotting the increasing fluorescence of the CPM dye as a function of temperature. A biphasic transition is observed for the disulfide-trapped sample, likely due to the presence of both non-covalent and disulfide-trapped sub-populations. (B) First derivative curves of (A) demonstrate the positions of the peaks used to calculate Tm. A double-peak is clearly present for the disulfide-trapped sample. (C) Melting temperatures are calculated from the derivative curves. The disulfide-trapped sample shows two Tm’s one of which is indistinguishable from the non-covalent sample Tm.

